Visualization Software for Real-Time Embedded Analytics
What is ITTIA Analitica?
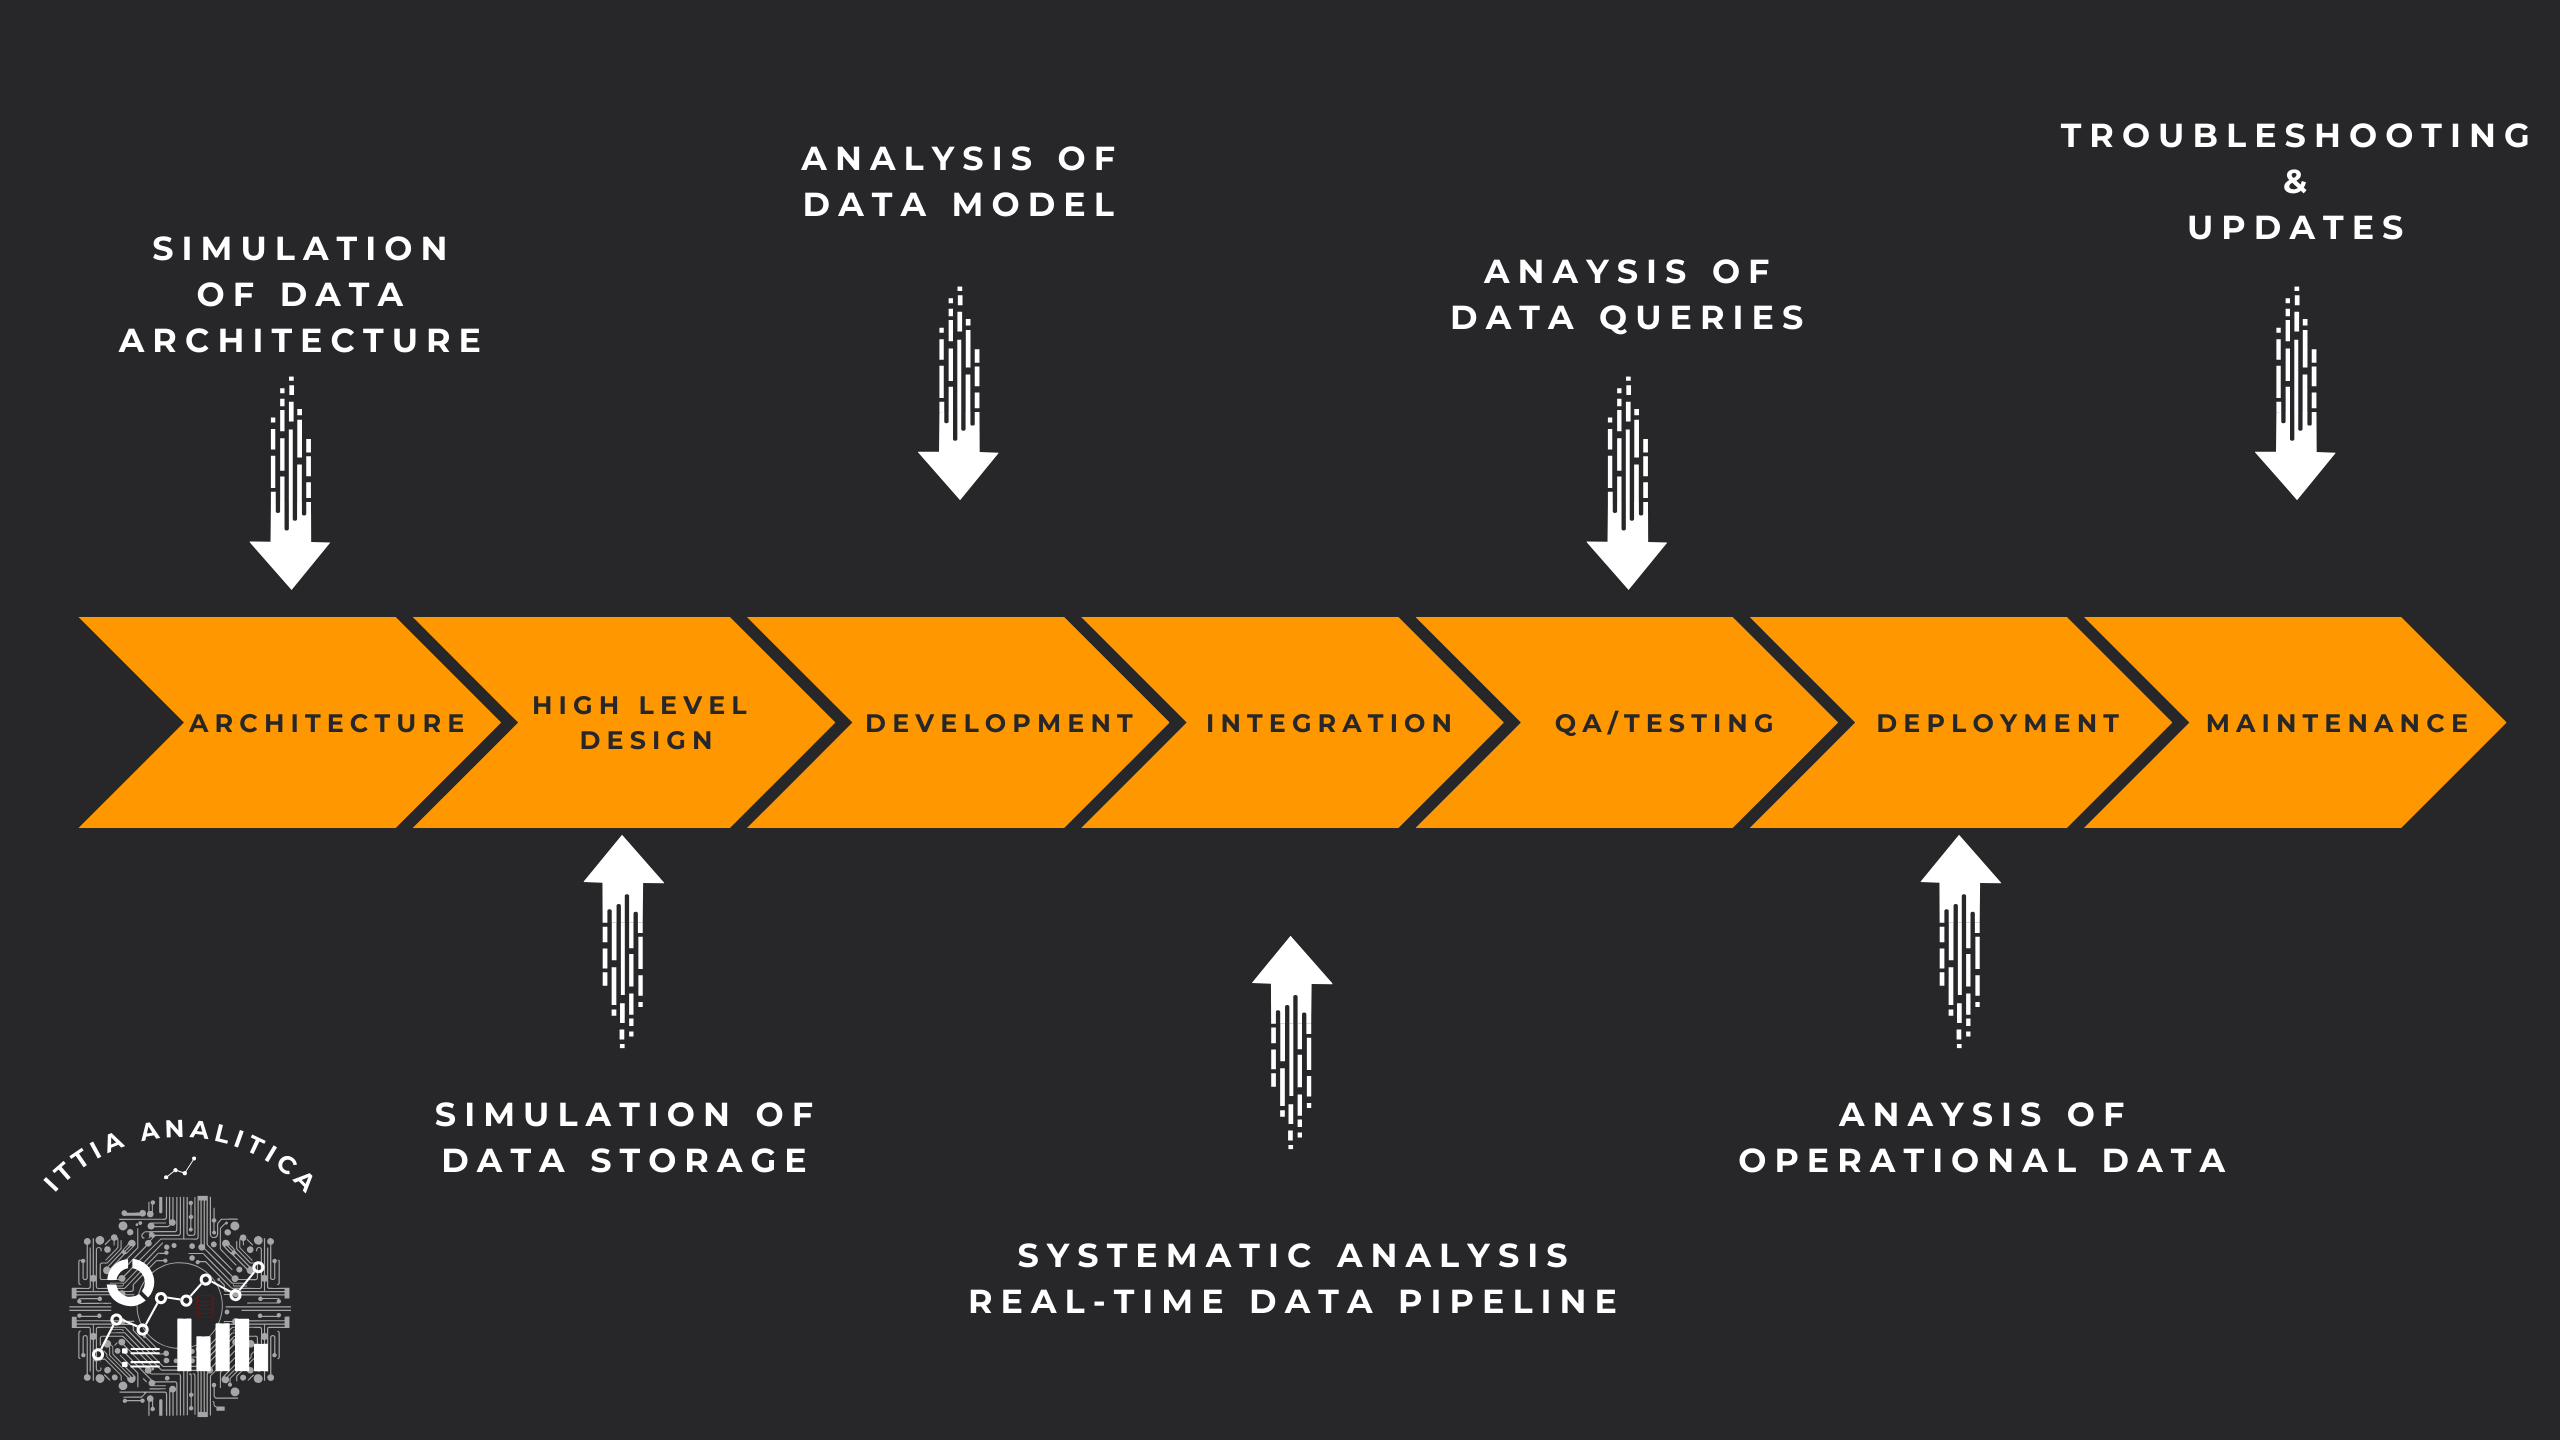
ITTIA Analitica is a cross platform real-time data observatory and analytics platform for embedded systems to visualize and query ITTIA DB databases. A simple and easy-to-use interface enables visualization and exploring both fresh and historical data. It empowers developers and end-users to execute queries, interact with tables and time series, work with real-time data streams, and create dashboards. With ITTIA Analitica, developers can easily build, confirm and validate database schemas and design data models before starting any coding. ITTIA Analitica makes it easy to understand and work with data, helping make better decisions through interactive visualizations.
With ITTIA Analitica developers are also empowered to interactively design data models for constrained devices, then connect to those devices to visualize data. Developers design a data model with standard SQL DDL statements, generate specialized C/C++ interface source code with ITTIA Analitica, and deploy into MCU firmware.
ITTIA SDL is Conformant to the Security Principles of IEC/ISO 62443
Capture and observe real-time data, data streams, time series information
Query with standards and SQL, import/export data and much more
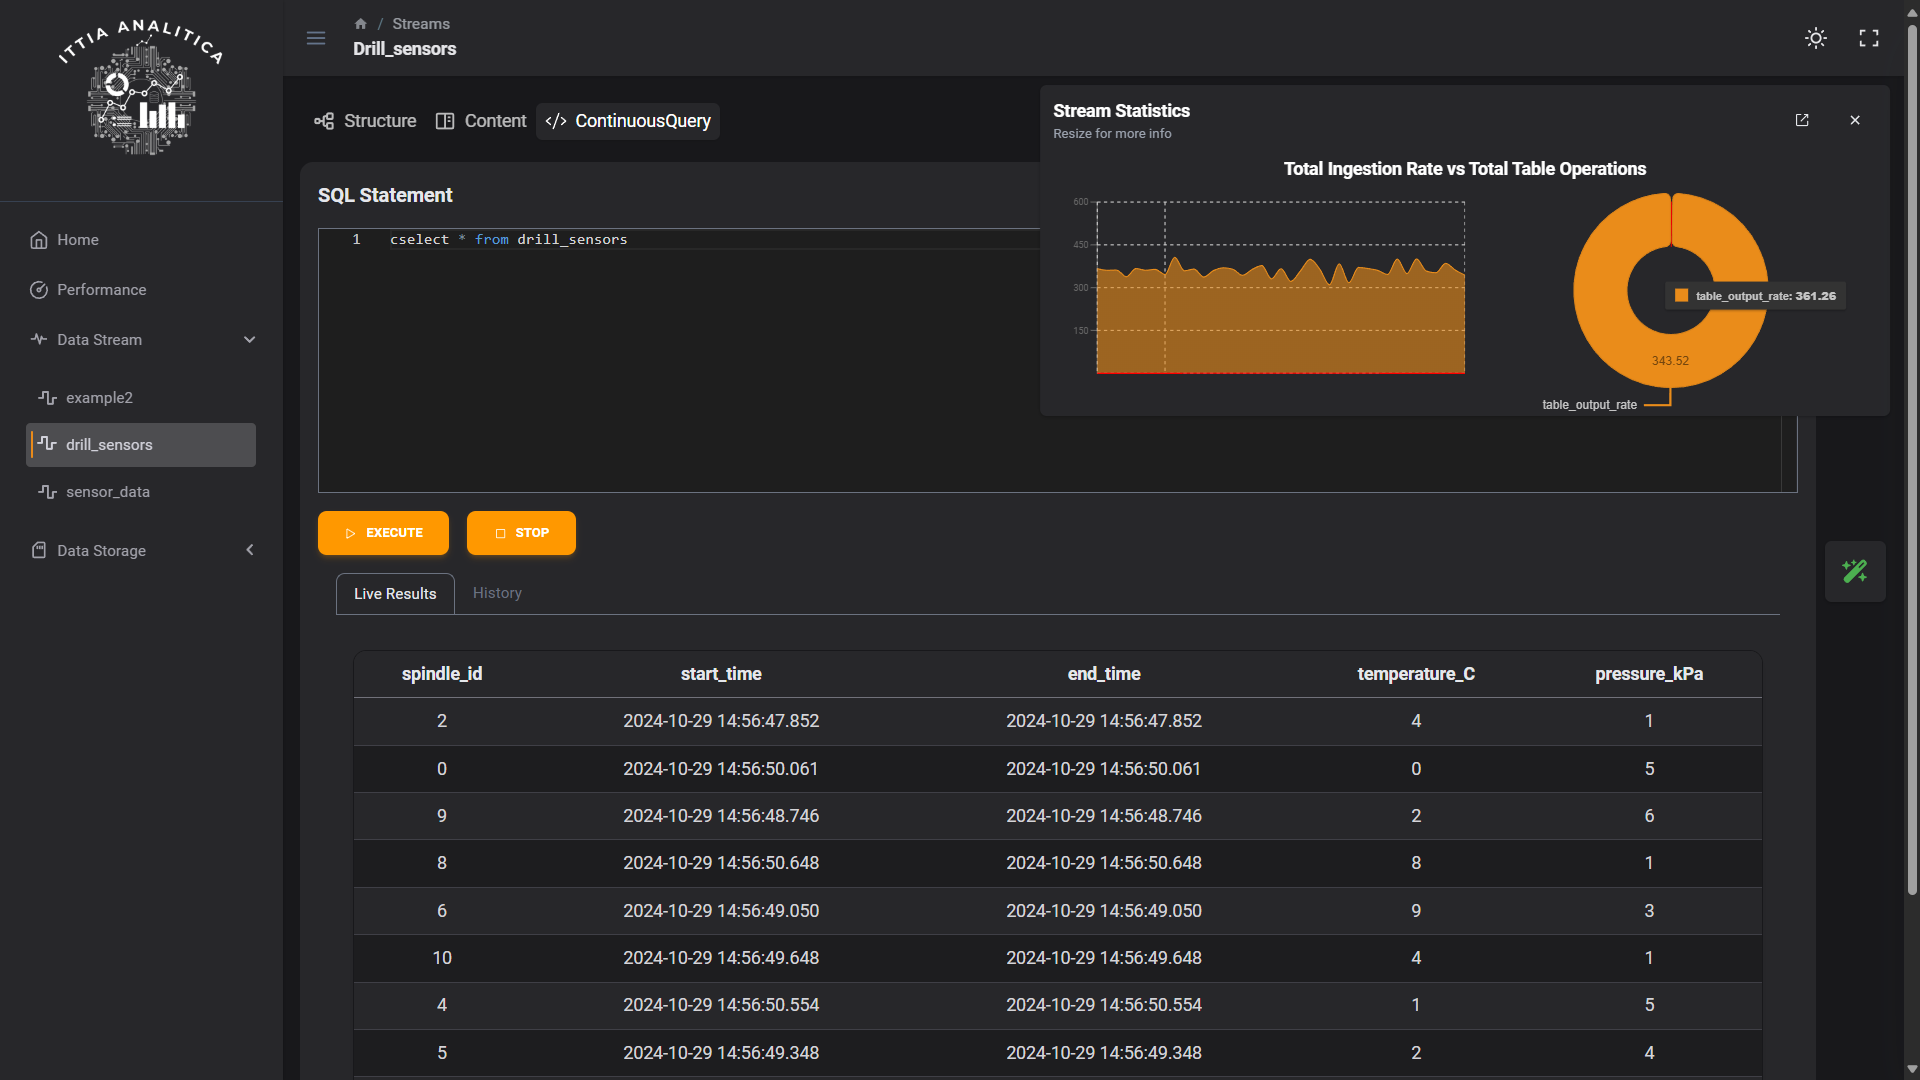
Built-in Scalable Stream Processing
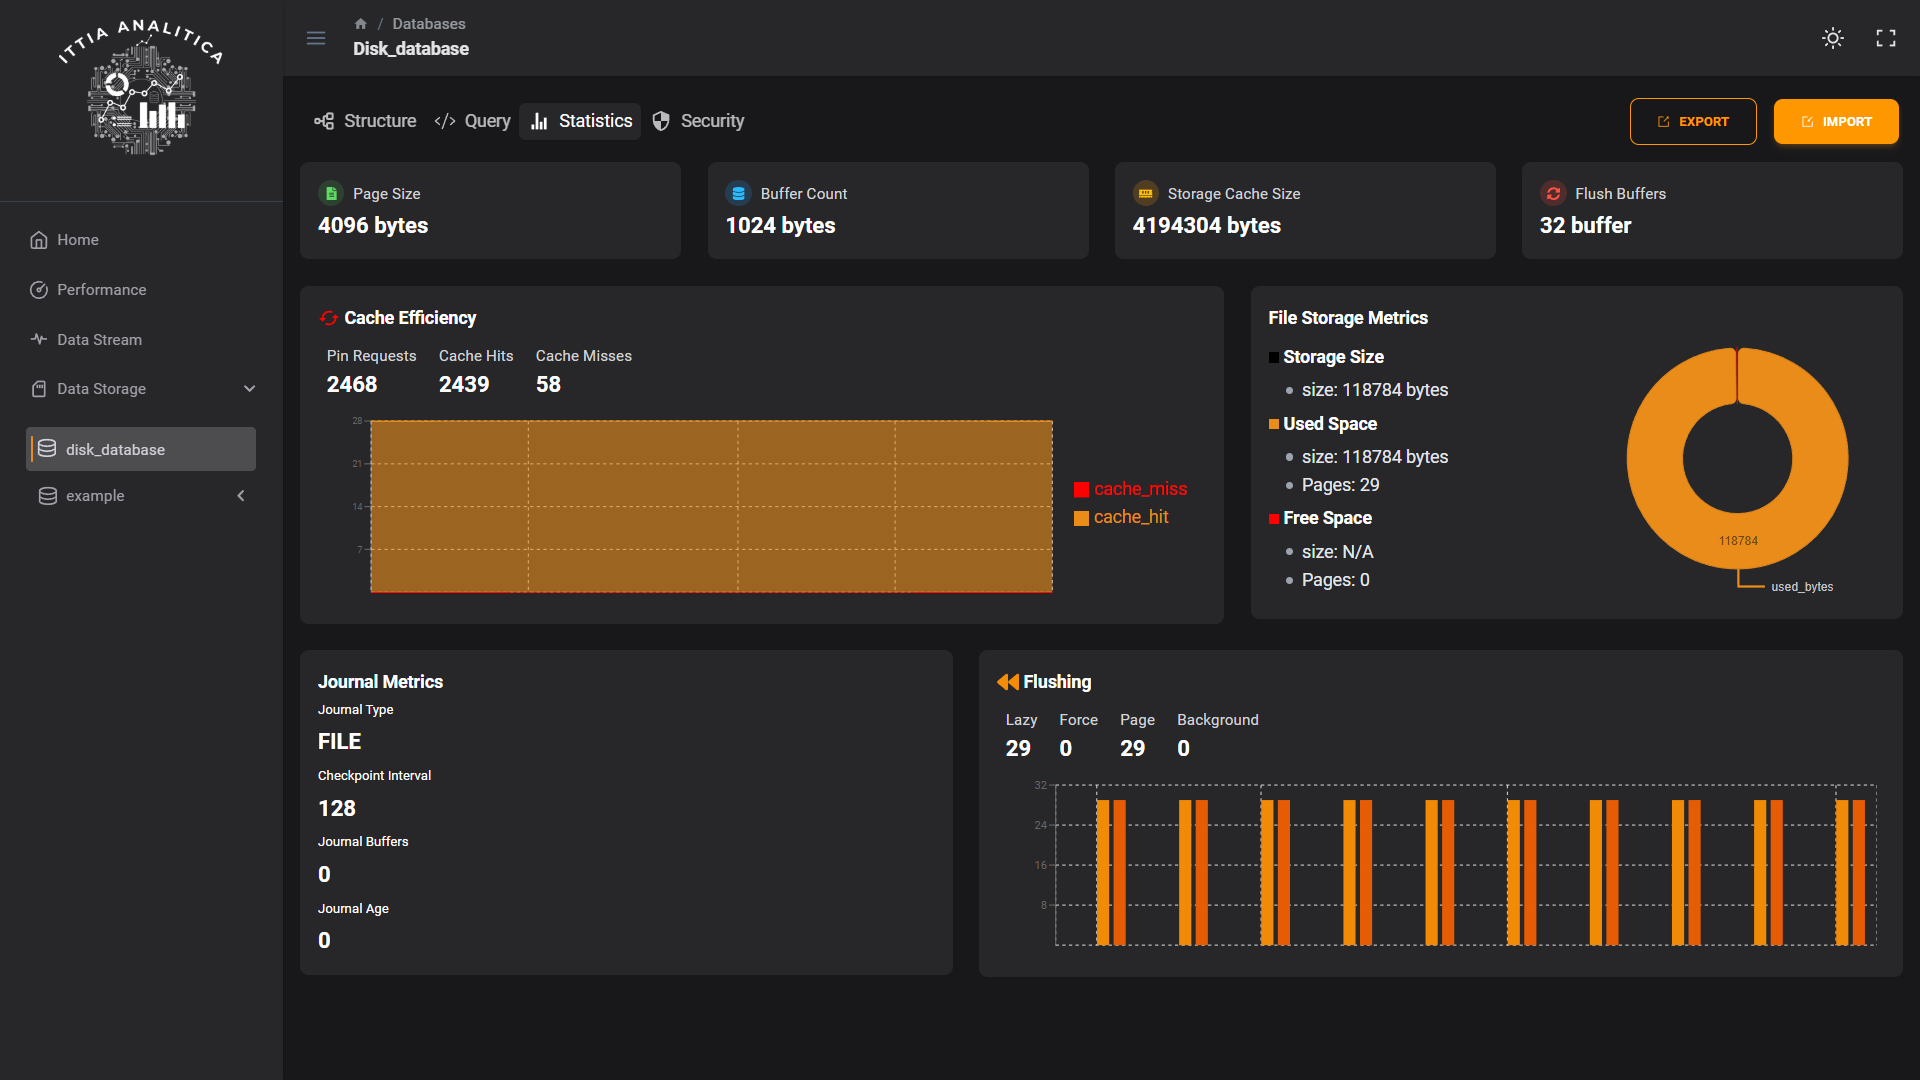
View and manage your devices’ data streams and query data in real time, view streaming statistics at a glance or in detail and even generate mock data for testing your data stream structure. Gather extensive and detailed data from all layers of edge device. Capture memory, performance, and other information about the system's overall behavior.
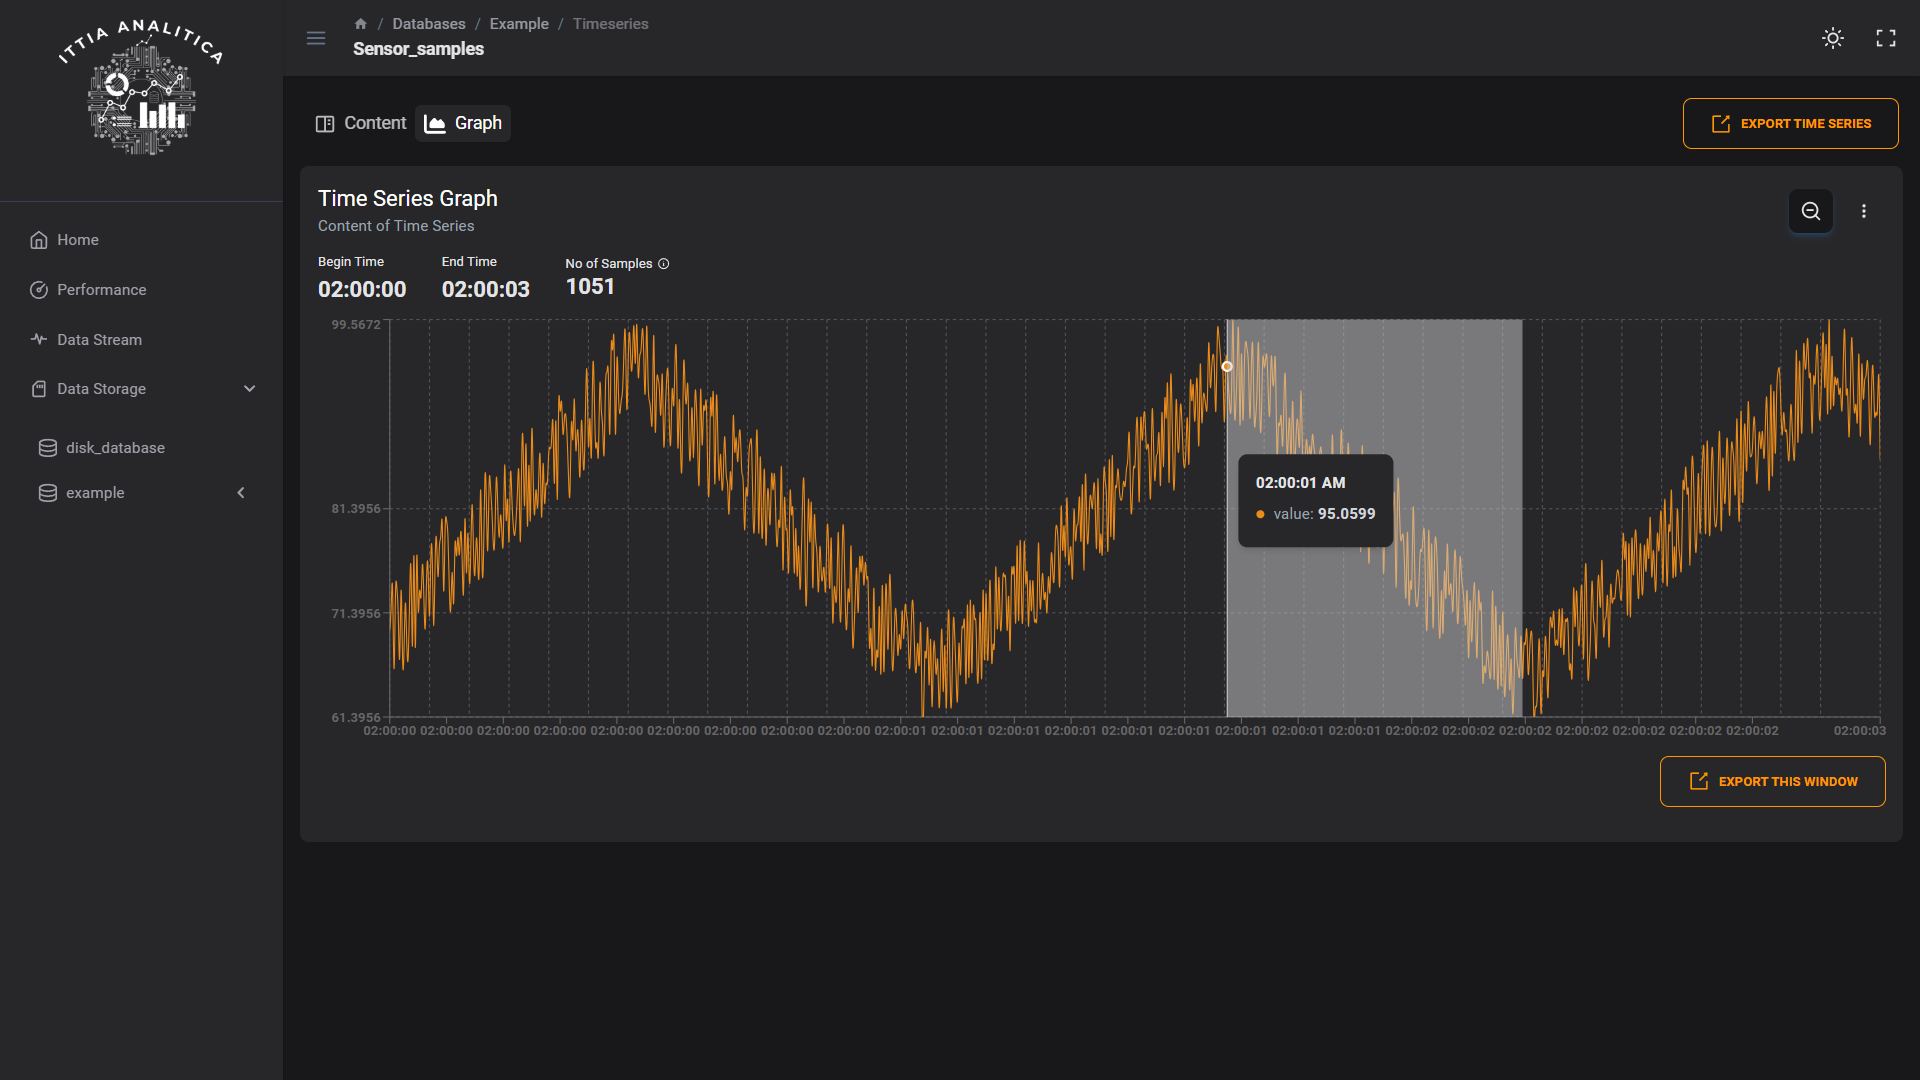
Develop Insights, Forecast Time Series Data
Maximize the full potential of device time series data, handle sensor metrics and events, ingest and query data at large scale for analytics. Aggregate configuration parameters, event logs, and sensor metric data at the edge, inside edge devices. Observe context beyond the measurements and timestamps captured from various data endpoints.
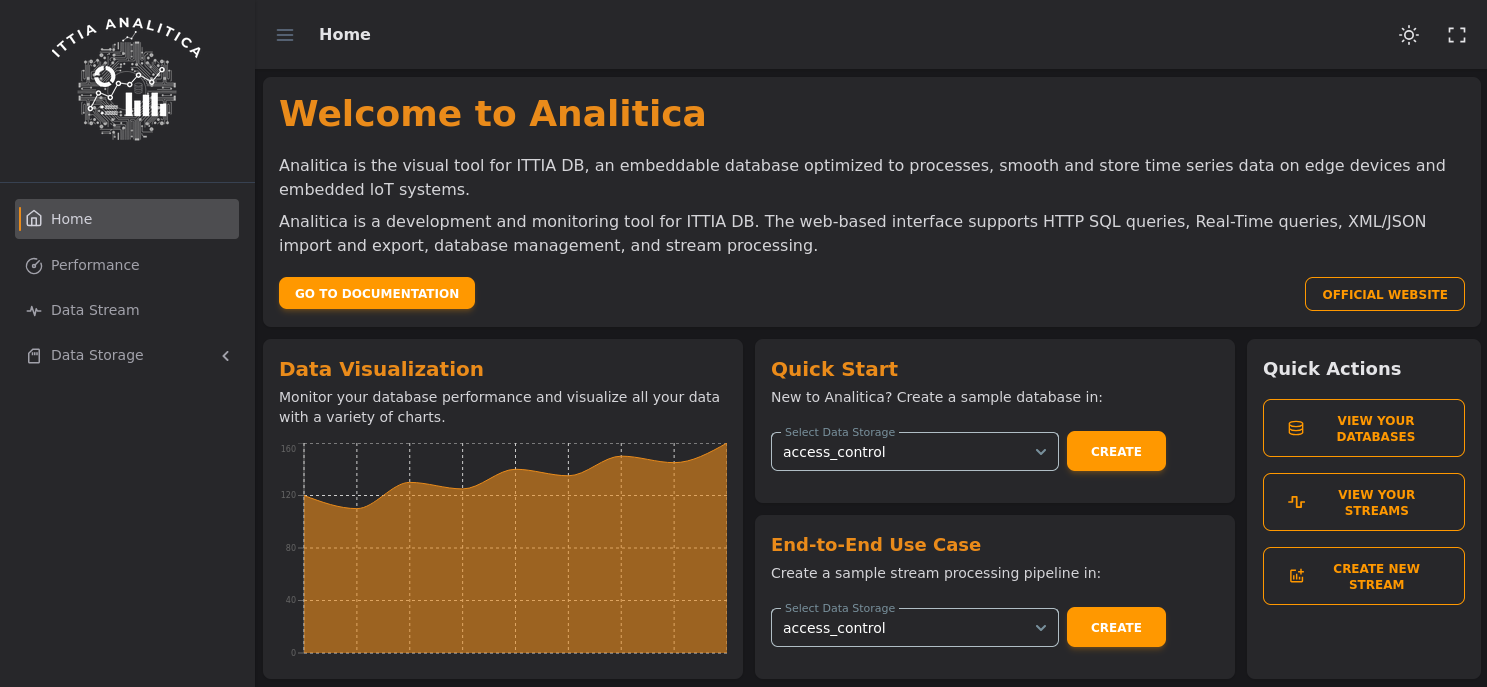
Create Real-Time SQL Dashboard
Manage with clear overview of data metrics and connect to collected historical device data at rest. Create relational SQL database, write SQL queries to predict and prevent failure. Benefit from live observations to monitor embedded systems in real time. Track events occurring within the entire collection of devices through proactive alarms and notifications.
Data Cockpit for Embedded Systems
Prototype, Validate, Code
Generate data to simulate a real-life scenario with sensor metrics and logs, then observe your database before building applications.
Real Time Statistics
Gain insight with live statistics that monitor query metrics in both ITTIA Analitica and applications embedded with ITTIA DB.
Query & Analyze
View and manage ITTIA databases, see tables, sequences, time series, and modify as you like, dive into a table and view or edit contents.
Design, Analyze, Manage & Deploy with Beautiful ITTIA Analitica